Sabtu, 31 Maret 2012

My worksheet (Snake and Ladders)


In this activity, you must play snake and ladders until finish. After that you must answer the question in below
a.    How many second you need to finish this game?
b.    How many minutes you need to finish this game?
c.    How many hours you need to finish this game?
d.    How many second you need if you are in the third line till fifth line ?
e.    How many minute you need if you are in the forth line back to the first line ?

After that you must complete this table.
No
Hours
Minutes
Seconds
1
....
65
...
2
3
...
...
3
...
...
180
4
...
...
800
5
....
115
...


Regard
Septy Cartika Sari
2010110036

Jumat, 30 Maret 2012

Creating new worksheet


Comment:
            Actually there is no correction from the lecture and also from my friends related with the problem in the worksheet. The lecture, namely miss. puti and also most of my friends in my class said that it’s good enough. Yes, I am grateful of it. Suddenly, I didn’t know what problem I should take into the worksheet. I had no idea at that time. Then, I just tried to think spontaneously. I was looking for some pictures and the other resources that could catch my attention first. I didn’t know why I chose those pictures. I was just interested in those pictures and I thought I can use those on my worksheet. Finally I put those on my worksheet and started creating a problem. It was nice, fun and unpredictable. I could create something new. No cheating and yes, I am satisfied with the result.
            In spite of it, there are still some corrections from my lecture related with the grammar that I used in the worksheet. I am grateful of it because my worksheet seems to be perfect now.
Note: These are some corrections from miss. puti. You can check the corrections out below. 

Before the correction:
In Annie Avantie’s boutique, there is still a special offer for buying some spring session dresses that are design by the two most famous designers, Raf and Dolce.
After the correction:
In Annie Avantie’s boutique, there is still a special offer for buying some spring session dresses that are designed by the two most famous designers, Raf and Dolce. 
Here, you can see the worksheet after the correction. I make the new one of it. Check this out :)


Minggu, 25 Maret 2012

How to draw a graph of a quadratic equation

How to draw a graph of a quadratic equation.
1.     1. We must know the quadratic equation. y=x2+bx+c
2.     2. Find intersection point in y axis. When x=0  then y= a(0)2+b(0)+c and we get point (0,C)
3.      3. The intersection point in x axis. When y=0 then 0=x2+bx+c  and we get two point  (X1,0) and (x2,0)
4.     4.Using the equation of axis symmetry is the line  X= -b/2a
5.  5. Find the vertex of coordinate using the formula are (x,y) is equal to  (-b/2a, -D/4a). D = b2-4ac
6.     6.The last we draw the graph based on the point we found.  Example we found the point are (0,-8), (-2,0) and (4,0), 1, -9)


Regard
Septy Cartika Sari
2010110036

Graphing a Quadratic Function

1.    First of all you have to know that the equation of quadratic function is y=x2 + qx + r.
2.    Mostly the quadratic function has intersection with x-axis and or y-axis. So you have to find it to make you easily draw the graph.
3.    You will get the x-axis intersection by substitute the function you have using y=0. Maybe you will get one point, two point or not both. If you didn’t get any point, it means that the graph is located under the x-axis or upper the x-axis without have intersection with the x-axis.
If you get one point, it means the point you get is the vertex of the graph. And if you get two points, it means the graph has two intersections with x-axis. Because the normally found is two points, let us use it to be example. We called the intersection point with (a,0) and (b,0)
4.    Find the y-axis intersection by substitute x=0 to the function. The meaning of y-axis intersection that you get is similar with the meaning of x-axis intersection. Because we already choose two intersection points at the x-axis intersection before, so the y-intersection is just one point. Let’s called it (0,c).
5.    The next step of graphing is finding the vertex. Vertex can be found by using formula. But don not worry if you forget the formula, you may use this step; use the x-axis or y-axis intersection to count the vertex, in case axis has two intersections point with the grapd. For instance, if you get two intersections at y-axis you have to use it. And if you get two intersections at x-axis, let’s use that point to find the vertex. In logic, when the graph passing through two point at x or y, the vertex coordinate of x-axis or y-axis will be located at the central of the two point. As I already say that we will use the two intersection of x-axis as example, so we have point a and b at x-axis. Count the differences of that two, and then divide it by two. We called the result x=d.
6.    Finding the x-coordinate of vertex, substitute the x=d for finding the y-vertex coordinate. Then call it y=e. Hence we have the vertex coordinate at (d,e)
7.    You already have points: (a,0), (b,0), (0,c), and (d,e). Try to figure out that point’s to the graph.
8.    If you still doubt about your graph, substitute independent x point or y point to the function so you will get another coordinate for accurate the graph. 

Step to draw a Graph of a Quadratic Function

Hello students.

Today we will learn how to make a graph of a quadratic function. Are you ready?

1st step
*) We should find the intersection points of x-axis and y-axis. We can find the intersection of x-axis if y = 0. And  we can find the intersection of y-axis if x = 0.

2nd step
*) This step will help us to find the minimum or the maximum point of a quadratic function. If we want to find the point, we can use (x,y) = ( b/2a , D/-4a ). Did you know what is variable D? This variable represent determinant. We could find determinant by the root of b square-4ac..

3rd step
*) After we find all points, draw the points into a Cartesian diagram and then, we have to make a line that connect each point that we find.

This is the manual step to draw a graph of a quadratic function. If we want to draw a graph using software, such as geogebra or maple. We only type our quadratic function into the command column, and after that the software will show us how the graph of the quadratic function.

Thank you.


Dyah Ayu Setyani
B4/ 2010110037

Instruction in Math Project

Hi, to provide instruction to our students especially in math, as a teachers we need to give instructions clearly and precisely. In addition to providing an overview to the students about the project, we provide instructions 
along with examples of projects that can be made by the students as below :


                       The introduction

 The Task


                                                                         The rubric


Comment from my friend about the instruction is good and we made clear enough but there is a suggestion that  if the project described point-point.
 Team work :
                              Hana Sofiyana
                                                         Susi dariah
                                                                                Dian Sulistiani

How to Make Graphic of Quadratic Equation


Steps How to Draw a Graph of a Quadratic Function
By : Hana Sofiyana
·       Find the x-intercept if y= 0. You can use factorization of ABC formula.
ABC formula:      Find = (x1,0) (x2,0)
·       Find the y-intercept if x=0.
·       Next step, find the symmetry line use y =-
·       Find the vertex 
·       Next, find some additional points, to help you fill in the graph. Click this website to find the examples. http://www.purplemath.com/modules/grphquad4.htm
·       Plot all of point on a Cartesian diagram.
Thanks

Math Project for The Classroom

by:
Dyah Ayu
Siti luthfah
Umam
the first instruction
the final instruction


How to graph of a quadratic equation?


:) the teacher gives the students quadratic equation....
Such as, Y = X2 + 1
:) start to make a graph of the equation
The process:
1.        1.Determine the intersect point of X1,2 axis, y=0 by factorization or  ABC formula
Use factorization
Y = X2 - 1
(x1 + 1) (x2 – 1)
X1 = -1
X2 = 1
So, you get the intersect point is (x1, 0) and (x2, 0) or (-1, 0) and (1, 0)
2.      2. Determine the intersect point of y1,2 axis, x=0
    Y = X2 – 1 substitute the X to 0
    Y = 02 – 1
       = -1
So, you get the intersect point of y axis is (0, y) or (0, -1)
3.      3. Now, try to sketch the intersect point in the diagram Cartesiangrafik 1.png

4.    You draw a nicely smooth curving line passing neatly through the plotted points.

grafik 2.png
5.    After you get the graph. Now,  you should determine the line of symmetry using formula like that X= and determine the extreme point (x , y) = ( , )

6.     The last, you can make the graph of quadratic equation on geogebra, and compare your answer that you get manually and with the geogebra. If the answer is similiar, so the answer is correct.

siti luthfah
2010110029 

Instruction-Project Mathematics


Statistics Project

Summary: (Indirect Instruction)
This project must be visualized by poster which includes about one measurement of students’ height or weight or others. They get the data with measure of those components in the school with their group. Then they convert the data into diagram stick or path or pie or others.

Requirements: (Indirect Instruction)
·         Data of students’ height or weight or others which they search in the school (in table form)
·         Diagram which they convert from the data. Diagram can be diagram stick or path or others
·         Mean, Median and Mode from the data
·         Conclusion (interpretation) from the diagram

Presentation Roles: (Indirect Instruction)
1.      Every group has 10 minutes to present the product
2.      Others group are allowed to give question to group which present in the class
3.      All group can give feedback to group which present the product
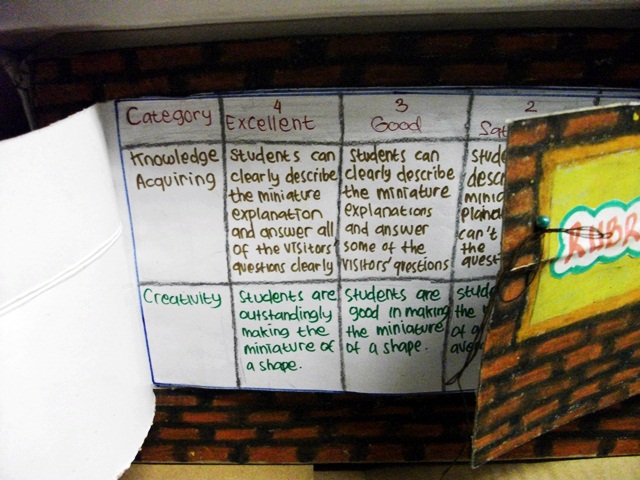
4.      Teacher will explain you about rubric of presentation and poster

Explaining the Project: (Direct Instruction)
·         “After you’re in your group, I will explain you about our project for this course”
·         “Your group will make a product that present the material of statistic”
·         “The product could be a poster that contain the data students’ height or weight or others”
·         “After you get the data, then you convert it into diagram pie or path or stick or others”
·         “Then you calculate the mean, median and mode from the data and put it on your poster”
·         “Make your poster be creative as well as you can”
·         “You should finish it on time and present it in the next session with your group”

Grouping: (Direct Instruction)
·         “Students, Please all of you take one of these colorful paper”
·         “Gather with your friends whose same color with your paper”